The #1 service for DB optimization by DWH.dev
Automatic detection service for database performance, security, and architecture issues
We will improve your database performance
holistic.dev helps you make your database faster,
more organized, and even more
secure

PostgreSQL
Available now!

Snowflake
Coming soon

MySQL
Coming soon
What kind of business are you in?
Cloud Providers
Get a solution to build a recommendation system for users of managed DB products
Get in touchDB Consulting
Help front-line employees give more effective recommendations for database optimization
Get in touchRetail
Connect your database yourself and get recommendations for improvement absolutely free
Get in touchMore than 1,300 rules to make your product faster,
your
infrastructure cheaper and more secure
and your team happier
Software architects, DBAs, data engineers, analysts, and product and engineering managers use our solutions for the following purposes:
Increasing app speed for revenue growth
Database performance improvement reduces query execution time and leads to more responsive user applications, which, according to research, has a dramatic impact on revenue growth.
Reducing infrastructure costs
Increased performance makes it possible to use cheaper hardware for database servers. Furthermore, more effective utilization of database resources has a positive impact on the performance of the application itself, which lowers costs by up to 30%.
Increasing engineers’ productivity
Thanks to the automatic assistant, engineers are able to identify the causes behind database malfunctions faster and with a broader range of competencies, allowing the same number of employees to service more projects and making it possible to hire less expensive service specialists.
Eliminating erroneous business decisions
Logic error detection in SQL queries reduces the possibility of incorrectly interpreting data used to build hypotheses and make business decisions.
Preventing data leakage
Architectural errors in database design can lead to loss or leakage of data, as well as direct loss of money in the form of lost profits or erroneous calculations. In the majority of cases, these errors are not detected in the testing process.
Detecting security problems
Unprocessed exceptions when a request is executed; queries that return more data than necessary; excessive queries that can lead to freezeups — such issues are difficult to identify before they arise.
How it works
Easy to get started - about 10 minutes
Get everything under control
Anytime
At any time, you can upload SQL queries and updated database schemas in the manual mode in the client area.
Anywhere
View the history of detected issues and summary statistics in the client area.
Immediately
If additional issues are found after new analyzer rules appear, we will inform you about it.
Collaboratively
Share reports with your teammates, partners, or auditors using personal links.
Privacy
No database connection needed
We process only the source code of DDL/DML SQL queries without any database connection. You choose what you want to analyze and can share any part of your queries.
No data needed
You don’t need to disclose database entries. We process only the source code of DDL/DML SQL queries without database content.
No need to install proprietary software
All you need is internal database tools for extracting queries.
No application source code needed
We don’t need your application source code, only your SQL queries.
No public access to source code
We never publish your SQL query source code in any publicly available sources.
No public access to issue reports
We never publish reports on your issues in any publicly available sources.
Platform features
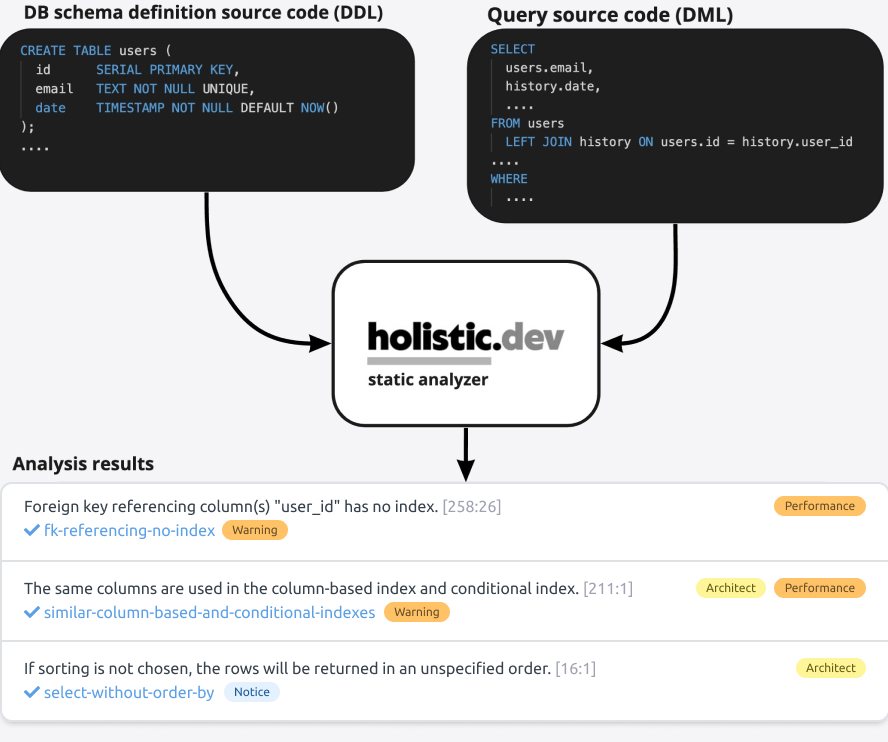
Statement static code analyzer
- Warning about architectural approaches affecting performance (query rewrite, index addition, etc.)
- Code Smell warning
- List of potential exceptions that may arise during a query call (violations of UNIQUE KEY constraint, FOREIGN KEY constraint, CHECK constraint, TypeCast constraint, etc.)
- List of affected read/write indices
- List of affected read/write relations
- And more...
Project static code analyzer
- List of columns never used in any of the project queries
- Unused default column values (replaced with actual values in all INSERT queries, not used in any of the UPDATE queries)
- Unused indexes
- Unused tables, views, materialized views
- Warning in case of different queries referencing objects with incompatible structure inside JSON columns
- Read-only/write-only tables
- And more...